Data Visualization

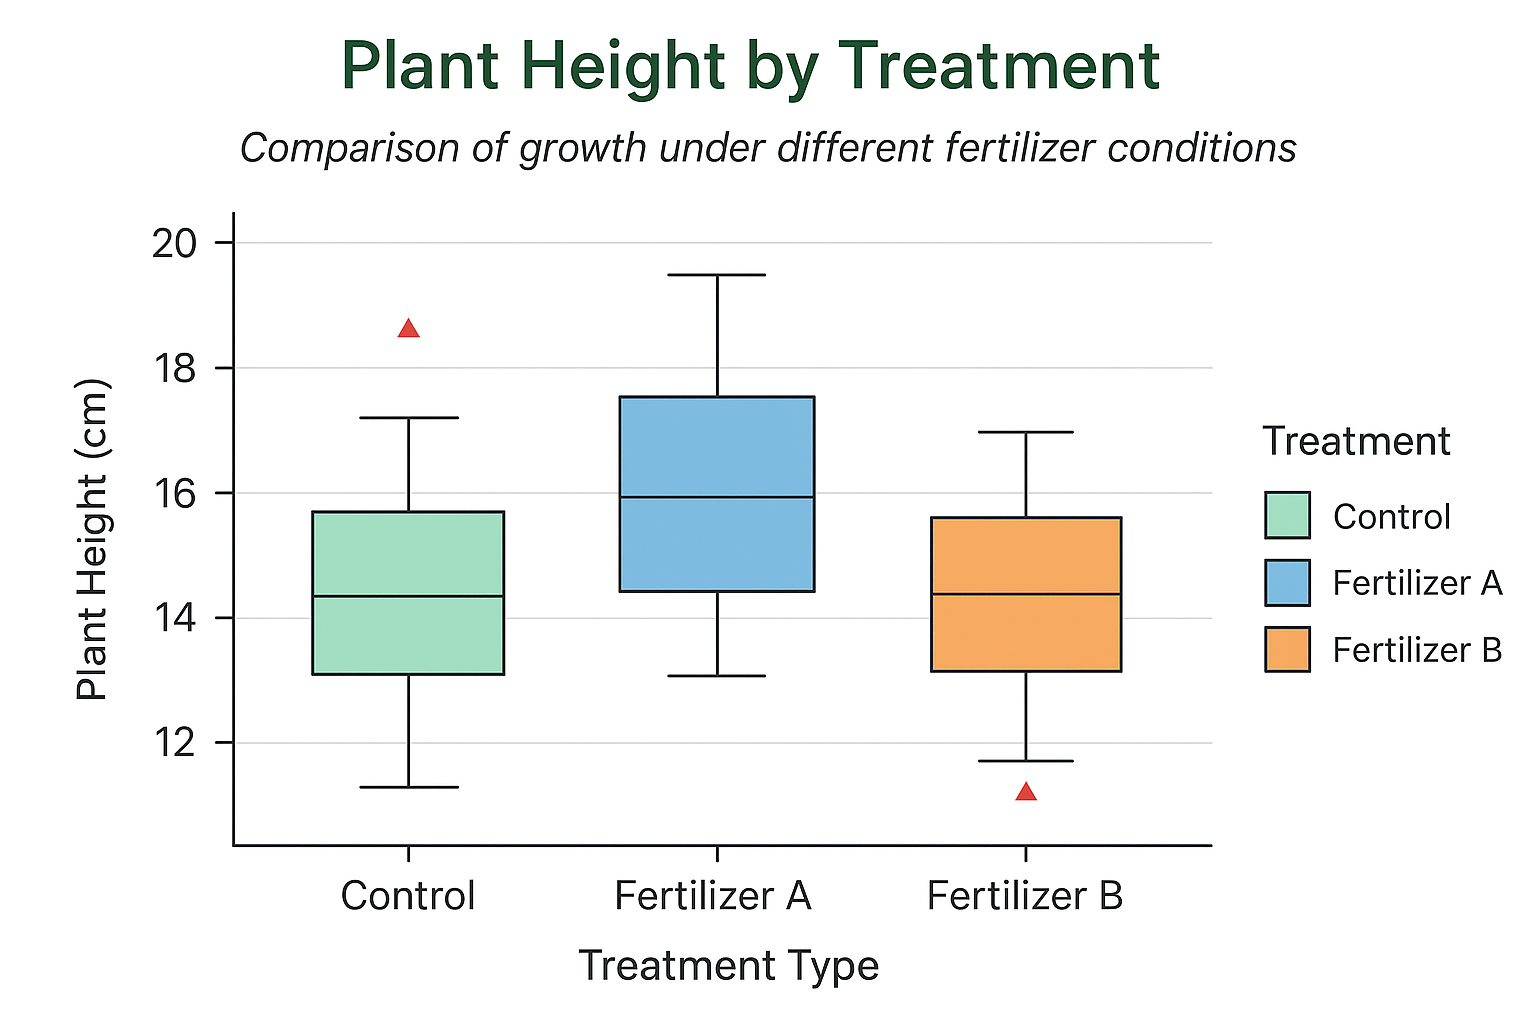
Box Plot in R (Biological Example): Step-by-Step Guide with Full R Script and Customization
Introduction Box plots (a.k.a. whisker plots) are a biostatistician’s best friend when comparing distributions across treatments, species, or conditions. They…
Read More
